Once you have decided on the time period and programmatic scope of your analysis, you can begin gathering the relevant data accordingly.
Next In: Nonprofit Cost Analysis Toolkit
The information you have gathered gives the true cost of operating each of your programs.
This knowledge can be used immediately for key decisions related to true costs, or combined with additional revenue and mission-alignment analyses to drive other decisions. Depending on the question you are trying to answer, further analysis may be required:
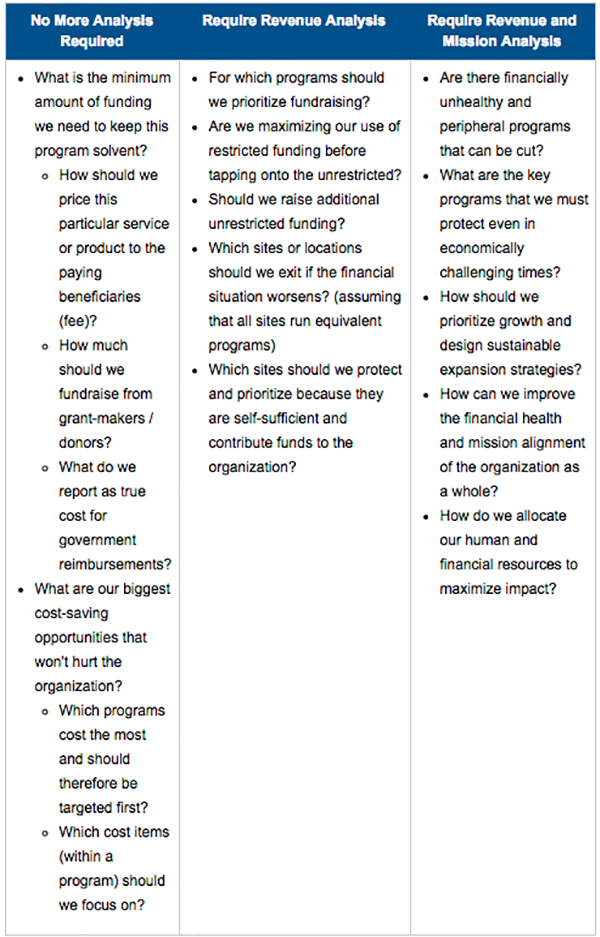
True-cost related decisions
For questions that fall under the “No More Analysis Required” category, your data from Step 5 should allow you to generate the observations you need to guide your decisions.
For the example of Nonprofit Anonymous, the data compiled up to this point, together with the associated graph (below) can offer a number of insights:
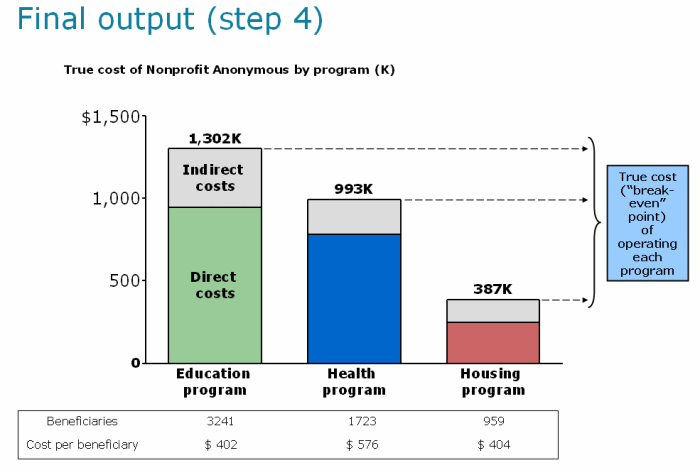
- The education program incurs half of the organization’s overall expenses, but also serves 55% of the organization’s beneficiaries
- The housing program has a disproportionately large overhead cost given the size of its program direct costs, while the health program seems to be leanest of the three
- The biggest overhead drivers for the housing program are its usage of: office space, ED’s time, CFO’s time and media relations director’s time (see Step 4 Excel sample)
- The CFO and the media relations director spend a disproportionate amount of their time on the housing program, contributing to the largest overhead cost percentage (see Step 4 Excel sample)
Other possible observations:
- For analyses that allocate across sites instead of programs, you can identify the most financially demanding locations and the most economically efficient ones
- For programs with particularly intensive start-up costs (fixed costs), such as foster homes, their allocation of overhead is likely to decline as the programs grow
The development director and the ED can now use the true cost data to make key decisions:
1. “Price” each program in order to:
- Fundraise the right amount of funds from donors (total cost of program)
- Set a fee for paying beneficiaries (cost per unit)
- Request government reimbursements (cost per unit) so that all costs are adequately covered.
2. Prioritize cost-reduction efforts by identifying the program with the largest costs and/or the largest cost categories within a particular program
Decisions requiring additional analyses
If one of your questions requires revenue and/or mission analysis, you will need to complement your true cost information with: 1) revenue analysis similar to what we just conducted for costs, and/or 2) a diagnosis of how each of your programs fits with your overall mission. It is not within the purview of this toolkit to offer detailed explanations of these additional analyses, but below are some snapshots to give you an idea of what is possible.
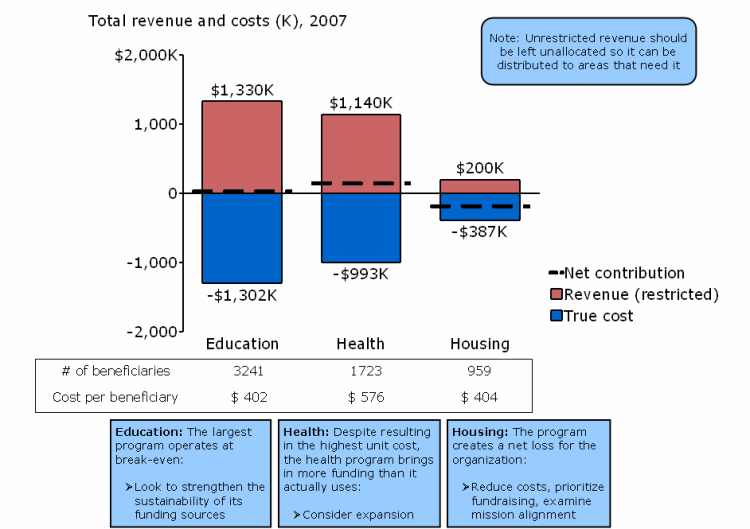
1. Adding revenue analysis:
The process of conducting a revenue allocation analysis follows a similar logic as the steps laid out in this toolkit to conduct cost allocation. By adding revenue analysis, nonprofit leaders may gain insights into the financial health and the net financial contribution of each program to the organization. This will allow them to:
- Prioritize fundraising initiatives
- Maximize impact by utilizing restricted funding effectively
- Exit or grow particular sites/locations, depending on their financial health (assuming they all administer the same program with comparable impact)
Example of adding revenue analysis to cost analysis:

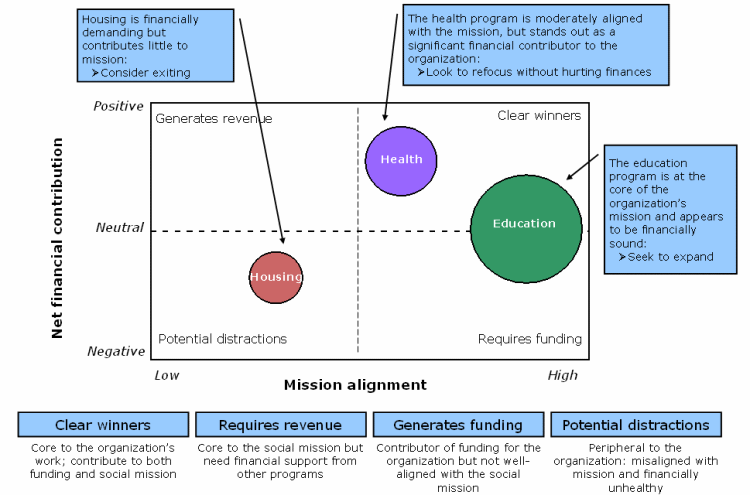
2. Adding mission alignment analysis:
Mission alignment analysis brings an important value-based perspective to our financial data. By adding mission alignment analysis to previous insights, nonprofit leaders may be able to:
- Allocate human and financial resources to serve the greatest need
- Prioritize core programs that must be protected even in economically hard times
- Identify peripheral and financially unhealthy programs to eliminate
- Design smarter growth strategies
- Improve the financial health and mission alignment of the organization as a whole
Example of adding mission alignment analysis to revenue and cost analyses: