When nonprofit organizations are able to invest adequately in staffing and infrastructure— “overhead”—they are better able to carry out their missions.[1] This isn’t a surprising notion. Consider the following two examples:
Learning Goes On Network
Learning Goes On Network (LGON) runs after-school programs that offer homework help, tutoring, and a variety of enrichment activities for students in elementary and middle schools. Since its founding seven years ago, the nonprofit has grown rapidly. During the first four years of that growth, LGON added programs and sites largely without bolstering its infrastructure or management capacity.
In 2004, realizing that the organization was over-extended but heartened by its successes and driven to increase its impact, LGON’s leaders developed a strategic plan to guide growth going forward. By 2007, LGON had doubled the number of communities in which it operated. Importantly, it also had increased its non-program staff by 150 percent, and had made several improvements to its systems infrastructure. For example, the organization had developed an intranet and purchased laptop computers to allow staff to share knowledge and plan meetings more efficiently.
LGON’s overhead costs have increased from 5 percent to 20 percent of its total operating budget. But as a result of its investments, the organization’s line staff members are better prepared to work with the youth they serve, and the central office is more responsive to the needs of individual sites. As Executive Director Amelia Johnson noted, “What I realized was that my penny pinching had the potential to hurt the kids as much or more than it helped them. LGON is a good example of what can and should happen when you pay attention to what investment is really required. We’re much higher functioning--and our programs are performing better because of these investments.”
Training the Leaders of Tomorrow
Dedicated to inspiring and supporting students from disadvantaged neighborhoods as they attend college and find employment, Training the Leaders of Tomorrow (TLT), founded in 1992, had opened several new offices by the late 1990s. But as the organization had grown, its infrastructure had fallen behind--particularly in the area of technology. By the early 2000s its computers, which had been donated in 1997, were getting slower and crashing regularly. What’s more, the firm that had provided TLT with its accounting software had gone out of business, so the organization no longer had access to technical support or upgrades. TLT staff members were falling behind on fundamental tasks, and important data was being stored improperly or lost.
Determined to remedy the problem, TLT leaders explicitly added technology issues into their strategic plan. They also committed to developing an integrated and customized network, and solicited pro-bono technology consulting. As a result, the organization now possesses a best-in-class system used by hundreds of TLT alumni to find leadership opportunities, and TLT has been recognized as a national leader in outcomes tracking. Executive Director James Dickson commented, “Our technology investments have had a direct impact on the quality of our programs.”
Related Content
Don't Compromise 'Good Overhead' (Even in Tough Times)What is surprising is that sector-wide, these two organizations are the exception, rather than the rule. Their ability to invest in critically important capacity-building initiatives is rare. Why is that the case? What's getting in the way of such good practice?
We at Bridgespan wanted to gain a better understanding of the roadblocks that prevent more nonprofits from similarly strengthening their capacity--their human resources, systems, and infrastructure. To that end, we synthesized existing research on nonprofit overhead costs, conducted interviews with a range of nonprofit managers, and examined four nationally-recognized youth-serving nonprofits in depth.[3] (Two are mentioned above.[4])
The results of our study illuminate a situation that is as pervasive as it is troubling. Many organizations and their funders are locked in a vicious cycle in which nonprofits are pressured to under-invest in overhead and to under-report their true overhead costs, even when those costs are still below what their senior managers feel is needed.
What’s more, the problem extends well beyond unrealistic expectations and deceptive communication between funders and organizations. This vicious cycle has grave consequences for an organization’s ability to have impact. As unrealistic overhead expectations place increasing pressure on organizations to conform, executive directors and their boards can find themselves under-investing in infrastructure that is necessary to improve or even maintain service-delivery standards, particularly in the face of growth. In the short-term, staff members struggle to “do more with less.” Ultimately, though, it’s the beneficiaries who suffer. As one nonprofit leader commented, “Operating with sub-par systems has meant that we simply couldn’t support a bigger network. A smaller network, of course, means serving fewer kids.” Another pointed out the “before and after” difference since his organization invested in developing a system for sharing and tracking outcomes: “[Before the system], the staff only looked at youth outcomes a few times a year, and collecting those outcomes required a 10 to 20 percent premium on the entire staff’s time. [Now], the site staff have a lot more time to spend with kids and have access to up-to-date data that can inform their programs.”
Our research did uncover a few bright spots on the horizon, as the experiences of the four organizations we studied will attest. These nonprofits--each of which has a diversified funding stream, including monies from government, foundation, and individual sources--have managed to expand their capacity in critical ways. Importantly, they have also laid the groundwork for supporting those changes over time, and for making future overhead investments. All four still underreport their “true” overhead costs. But they are closing the gap between what they report, what they really spend on overhead, and what they feel they need to spend in order to operate optimally. Equally importantly, they are seeking to communicate with staff, board members, and funders in a way that captures the tie between overhead investment and programmatic outcomes. In doing so, they are increasing their chances to grow in a sustainable way.
The lessons they have learned, coupled with Bridgespan’s own experience working with foundations and with nonprofits developing business plans, suggest some steps that other organizations and their supporters can take to create an environment in which healthy growth is no longer the exception, but the norm.
The Vicious Cycle
The first step is understanding the forces that form and drive the vicious cycle. Here’s how it works:
- Misleading reporting: The majority of nonprofits under-report overhead on tax forms and in fundraising materials.
- Unrealistic expectations: Donors tend to reward organizations with the “leanest” profiles. They also skew their funding towards programmatic activities.
- Pressure to conform: Nonprofit leaders feel pressure to conform to funders’ expectations by spending as little as possible on overhead, and by reporting lower-than-actual overhead rates. (Figure 1 illustrates the cycle.)
Figure 1: The vicious cycle

Misleading Reporting
Common sense alone dictates that some of the numbers being published by nonprofits on their financial statements are unrealistic. Consider the findings of a study completed in 2004 by the Urban Institute’s Center on Nonprofits and Philanthropy and the Center on Philanthropy at Indiana University:
- When researchers examined the tax forms from 220,000 nonprofit organizations to determine the accuracy of financial reporting, they found “widespread reporting that defies plausibility.”
- Over a third of the organizations in the study reported having no fundraising costs whatsoever, while one in eight reported that they had no management and general expenses.
- Further examination found that 75 to 85 percent of these organizations were incorrectly reporting the costs associated with foundation or government grants.[5]
Nonprofit funding campaigns often reflect a similarly skewed picture. Literature boasting that 90 percent or even 100 percent of every dollar donated goes to fund programs is commonplace, despite the fact that such assertions strain belief. Nonprofits typically are able to make this claim only because they raise unrestricted funding that goes entirely to supporting overhead costs. As one executive director disclosed, “We can tell donors that 10 percent of their contribution will go to overhead. All that means is that we’re going to have to raise pools of general support to pay for our real overhead costs.”[6]
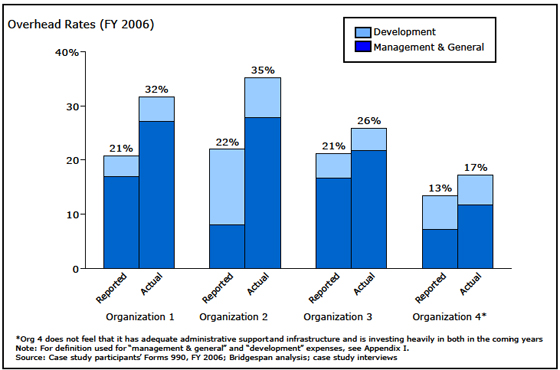
The experiences of the four organizations we researched in depth for this paper support those study findings. When we calculated their true costs of doing business and compared those figures with their reported overhead rates (both on their 990s and in their literature), we found marked discrepancies (see Figure 2). While they reported overhead rates between 13 and 22 percent (with three of the organizations tightly grouped at 21 to 22 percent), their actual overhead rates ranged from 17 to 35 percent. These discrepancies may be attributed in part to a desire to have overhead appear lower than it actually is. However, it is also the case that organizations may believe they are accurately reflecting their costs, when in reality they are under-reporting, because of issues with the IRS’ definition of overhead: For example, nowhere in its definition of program, management and general, and fundraising expenses does the IRS explicitly address how to account for marketing and communications activities. As a result, many organizations allocate all marketing and communications expenses to programs when, in most cases, these expenses would more accurately be reflected as administrative or fundraising overhead.[7]
Figure 2: Reported and actual overhead rates for the four organizations Bridgespan studied
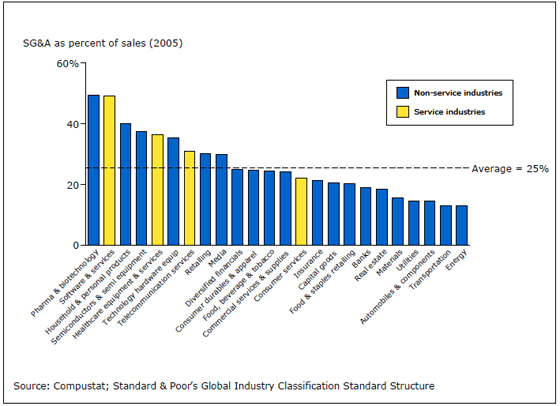
While for-profit analogies are by no way perfect benchmarks for nonprofits, they do provide some useful context in thinking about how realistic--or not--average overhead rates in the nonprofit sector are. An examination of 25 industries shows average overhead rates ranging from 13 to 50 percent, with the average across the industries being in the mid-20s (see Figure 3). Only seven of the industries had overhead rates less than 20 percent (the median reported rate for nonprofit organizations), and among service industries (arguably a closer analog to most nonprofits), none reported average overhead rates below 20 percent.[8]
Figure 3: For-profit Overhead rates by industry
Unrealistic Expectations
While many in the funding community may know that the overhead figures reported by nonprofit organizations are artificially low and that their appeals literature is not accurate, the numbers nonetheless influence funder expectations. A 2001 survey conducted by the Better Business Bureau’s Wise Giving Alliance found that over half of adult Americans felt that nonprofit organizations should have overhead rates of 20 percent or less; nearly four in five felt that overhead should be held at less than 30 percent.[9] In fact, those surveyed ranked overhead ratio and financial transparency to be more important attributes in determining their willingness to give to an organization than the demonstrated success of the organization’s programs.
The nonprofit managers we interviewed said that in this context it’s a tall order to expect a struggling organization to break ranks and be honest in their fundraising literature, even if they know that their own literature fuels unrealistic expectations. When a random survey of mail coming over the transom reveals literature from several organizations that mention their low overhead costs, and one that even touts, “100 percent of your donation will go towards programs that help children; zero percent will go to overhead,” it’s hard to make a case for spending on infrastructure. One nonprofit manager summed it up: “In order to secure funding to serve more kids, we tell a great story about child impact and growth…no one wants to hear about infrastructure.” Another interviewee noted, “Donors often ask me about our administrative costs…it seems that they always want to make sure that we’re under 20 percent. I always end up launching into my spiel about the importance of effective administration. It’s so frustrating!”[10]
Unrealistic expectations of overhead expenditures extend beyond individual donors to government and foundation funders as well. While these entities do not necessarily restrict their funding based on program ratios, they generally limit the amount that can be used for overhead expenses. (Program ratios refer to the proportion of overall expenses that go toward program-related activities, as opposed to indirect expenses.) All of the organizations we spoke with were managing government contracts from local, state, and federal sources, and none of the contracts had indirect allowances over 15 percent; some contracts had no indirect allocation at all. Many times, the indirect allowances in these grants do not even cover the costs of administering the grants themselves. For example, when one Bridgespan client added up the hours that staff members were spending on reporting requirements for a particular government grant, it found that it was spending a sum equal to 31 percent of the grant amount in order to administer the grant, though the funder had specified that the nonprofit allocate only 13 percent of the grant to indirect costs.
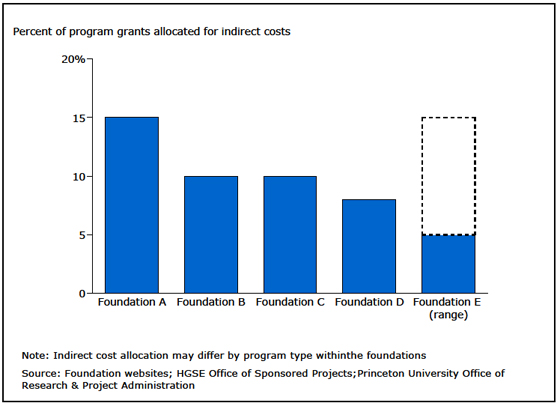
Some foundations allow for more generous indirect cost allocations. One case study participant commented that, “For (some) foundations, we’re able to calculate and share a more generous overhead figure of 20 percent, which still isn’t sufficient but gets us closer to actual costs.”[11] However, foundations as a group can be quite variable in their indirect cost allowances. Even within the variation, these allowances are typically 10 to 15 percent of each grant allocation. From the experience of many Bridgespan clients--and certainly the organizations included in this study--many, if not most, foundations, however, are as rigid with their indirect cost policies as government funders. As one interviewee said, “I don’t know of too many foundations where we could have an open discussion about our real overhead.”[12] Figure 4 provides the indirect cost allowances offered by four foundations with assets greater than $1 billion.
Staff interviewed at the four organizations we studied and also at other nonprofits revealed a variety of factors motivating them to report overhead as they do. As noted, funders pressure them to show lean profiles. But these managers also said that the practice of misreporting overhead is tacitly supported within the sector. One commented, “The 20 percent norm is perpetuated by funders, individuals, and nonprofits themselves. When we benchmarked our reported financials, we looked at others, [and] we realized that others misreport as well. One of our peer organizations allocates 70 percent of its finance director’s time to programs. That’s preposterous.”
Figure 4: Indirect cost allowances for foundations with assets greater than $1 billion
Other studies bear this out. According to a survey conducted by the Chronicle of Philanthropy, a majority of nonprofits report that their accountants advised them to report zero in the fundraising section of Form 990.[13] This practice is furthered by the limited IRS surveillance of nonprofits’ Form 990 tax reports: the $50,000 penalty for an incomplete or inaccurate return is rarely levied, and is generally applied only when an organization deliberately fails to file the form altogether.[14] As another Bridgespan interviewee noted, “Improperly reporting these expenses is likely to have few, if any, consequences.”
Pressure to Conform
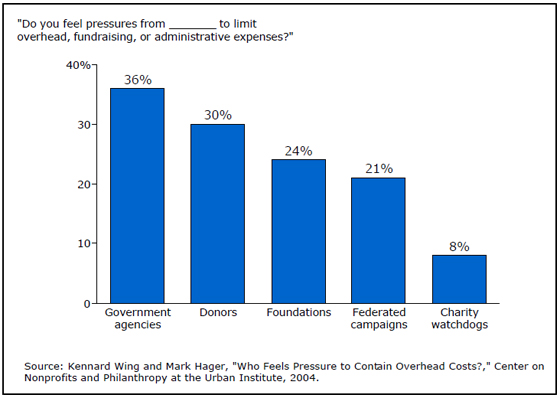
While nonprofits report pressure from a variety of sources (as shown in Figure 5), a survey conducted as part of the Nonprofit Overhead Cost Project found that the most direct pressure came from funding sources (government agencies, individuals, and foundations). The survey also found, however, that external watchdog organizations played a role in influencing donor behavior, a sentiment that was echoed by our interviewees.[15] Two of the major nonprofit watchdog groups, Charity Watch and Charity Navigator, include financials in their ratings and explicitly recognize the program ratio as part of their assessment.
Figure 5: Sources of pressure to limit administrative and funding expenses
The impact of the resulting “low pay, make do, and do without” culture, as articulated in the Nonprofit Overhead Cost Project, is felt throughout an organization but is especially painful in the areas of staff and systems. Figure 6 details a few of the comments made by our interviewees and others about the impact of a “low pay, make do, and do without” culture.
Figure 6: Examples of “low pay,” “make do,” and “do without”
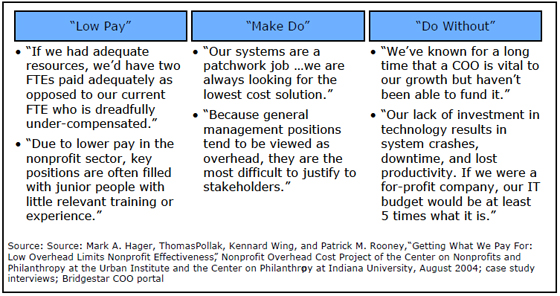
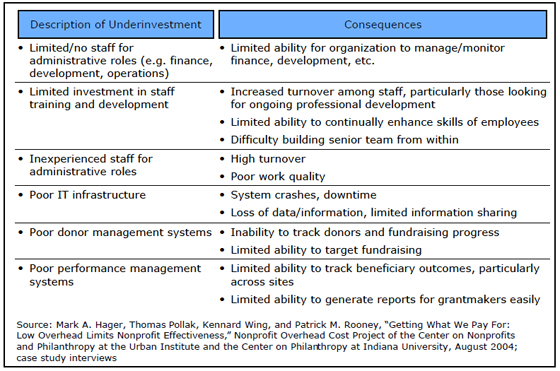
Figure 7 depicts some of the consequences of such behavior. Clara Miller of the Nonprofit Finance Fund summed up the situation in a Nonprofit Quarterly article: “The inability of nonprofits to invest in more efficient management systems, higher-skilled managers, training, and program development over time means that as promising programs grow, they are going to be hollowed out, resulting in burned-out staff, under-maintained buildings, out of date services, and many other symptoms of inadequately funded overhead.”[16]
Figure 7: Consequences of Underinvestment
The nonprofit leaders we interviewed also noted that staff members can become acclimated to working in such circumstances and then have trouble justifying investments in overhead, even when they are clearly warranted. One of our interviewees, the CEO of an organization operating with sites across the country, told us that when his organization’s board had made it possible to create a much-needed COO position, the rest of the staff had resisted the move. “We [had] known for a long time that a COO is vital to our growth but [hadn’t] been able to fund it,” he said. “[But] they’ve lived so long in a starved organization that the idea of hiring a COO was preposterous to them. It’s been a real transition for us.”
Breaking Down the Cycle
Understanding the problem is not enough. And it would be unrealistic to call for organizations and funders to “just say no” and cease to participate in the cycle. But nonprofit leaders and other stakeholders can commit to changing their behaviors over time and move purposefully toward the creation of a culture in which healthy growth is encouraged and the pressure to under-report and under-invest is lessened.
Funders, for example, can take the following steps:
- They can increasingly support organizations with general operating funds (i.e., unrestricted funds), when feasible. While it may not be possible in all situations, particularly when the mission of an organization may not completely overlap with that of the funder, we have seen a tremendous benefit to providing organizations with general operating support. In particular, doing so allows organizations to make the tradeoffs themselves between areas of investment, and allows for more open dialogue between organization and funder on how the investment can and should be used.
- They can commit to paying a greater share of administrative and fundraising costs in their use-restricted grants. In 2004, the board of the Independent Sector encouraged funders to pay “the fair proportion of administrative and fundraising costs necessary to manage and sustain whatever is required by the organization to run that particular project.” Government funders should consider overhead recovery that is based on real overhead rates. For example, some federal funding contracts do allow nonprofits to justify an indirect cost rate (within guidelines) which can then be used for all federal grant applications.[17] Extending such a policy to all federal, state, and local government contracts can go a long way toward helping nonprofits deliver better programs while meeting the cost burden of managing the grant.
- Finally, they can foster more open discussions about overhead and, in so doing, encourage the development of a standard definition of the term. Currently, organizations have to report their overhead differently for nearly every grant that they receive. As one manager noted, “There is no consistent definition of the overhead cost rate because there are differences in how funders and others expect it to be computed.” A greater degree of standardization can allow funders to compare “apples with apples” and will allow grantees to gain clarity themselves on their overhead investments (or lack thereof). And having a dialogue about “real” overhead rates can help shift the focus to the real target--outcomes.
Nonprofit leaders seeking funding can also start to break down the cycle.
- One step they can take is to develop a strategy that explicitly recognizes infrastructure needs. Framing discussions about strategy around a clear plan that lays out the organization’s goals, the investment needed to achieve the goals, and the resulting benefits for beneficiary groups can be more useful than centering such discussions on costs. Even within the confines of a “cost conversation,” executive directors can use this type of plan to illustrate how infrastructure investments actually reduce the cost to serve over time.
- Nonprofit leaders can further increase their ability to invest appropriately if they communicate the logic for increased overhead investment throughout the organization, and to the board. A collective commitment from all levels of the organization, including senior staff and the board, is a powerful lever. Case studies of organizations that have successfully invested in their own infrastructure have repeatedly noted the difficulty of doing so without a shared agenda between the leadership team and the board.
- Finally, nonprofits can begin to provide funders with better ways to measure their performance than program ratios. In the Better Business Bureau survey, over 70 percent of individuals reported that they could not find sufficient information by which to assess a nonprofit or compare it to similar organizations in its field. Even small steps toward collecting and disseminating data on outcomes can help an organization provide a useful basis for measurement and dialogue. A conversation about costs to achieve outcomes (and about how investments in overhead can reduce those costs) can be much more meaningful than one that centers on program ratios.
Creating an “Impact Culture”
Our experience working with organizations of varying sizes suggests that these steps are doable. And given the research and momentum on the issue, there appears to be an opportunity for unprecedented dialogue between funders and grantees. The forces that fuel the vicious cycle are strong. But the opportunity to achieve more for beneficiaries over the long-term is a compelling incentive. As one nonprofit leader summed up, following a successful effort to align the organization’s board and funders around more realistic overhead investments: “We are a fundamentally different--and better--organization today than we were three years ago, and I attribute much of that to investments in building our capacity.” Another concluded: “We’re now an impact culture.”[18]
Appendix I
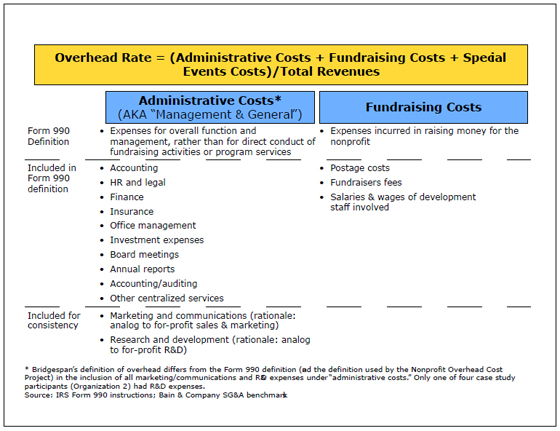
Bridgespan’s Definition of Overhead
Appendix II
Learning Goes On Network: Investing in performance management to build an “impact culture”
"For years I was the poster child for low overhead. In my mind, I was saving money on overhead so that we could better serve our kids. What I realized a few years ago, however, was that my penny pinching had the potential to hurt the kids as much or more than it helped them."
The Background
Learning Goes On Network (LGON) has been recognized by youth, funders, and nonprofits alike for its pioneering, successful approaches to providing high-quality, after-school academic and enrichment programs. Results are impressive: over 80 percent of the young people who utilize the program for a full academic year report marked improvements on report cards, as well as better attendance.
In the past three years alone, LGON has doubled the number of communities where it operates. In its early years, LGON had grown quickly, adding programs with limited-to-no new infrastructure or management capacity. “We had bootstrapped our growth and had managed somehow not to fall apart. But retaining strong staff and communicating effectively became incredibly difficult as we grew,” said Johnson.
The Challenges
In preparation for its most ambitious growth spurt, LGON embarked on a strategic planning process three years ago. Through that process, it became clear to Johnson that without an increase in management capacity and a dramatic overhaul of performance management and communications systems, LGON would not grow effectively, nor would the organization be able to serve its existing clients as well as it hoped. Specifically, Johnson and senior staff realized that:
- Program staff, who were supposed to be focusing exclusively on working with youth, were overburdened with manual data collection, resulting in a premium of up to 25 percent of their time over the course of a year.
- Slow, ineffective systems made it virtually impossible to isolate and understand the effectiveness of various program elements--across sites or by individual site. To analyze program results at the most basic level, one FTE in LGON’s central office spent 50 percent of his time compiling results in an antiquated Microsoft Access database.
- Due to a lack of central office capacity, sharing program results with sites was done in a limited, sporadic fashion, leading to site frustration about having to report results at all.
- Lacking a centralized knowledge and communications system, the central office staff had to print and hand-deliver all program materials--an inefficient, time-consuming, and costly process.
The Strategy
Johnson knew that reorienting LGON around strategic investments in infrastructure and management capacity would not be easy. Over the investment period, the organization’s overhead costs would increase from 5 to 20 percent of the total operating budget. LGON’s line staff was initially skeptical about making these types of investments. Johnson recalled, “Program staff had a really difficult time dealing with the idea that we were going to increase our overhead. People want to be able to say that for every dollar that comes in, we spend [close to] 99 cents on program. It’s been a cultural shift as much as an operational and strategic one.”
Johnson employed several strategies to help get people past their initial skepticism.
- Engaging with staff in a business planning process that identified the organization’s true needs. In interviews with Bridgespan, Johnson said that developing the strategy and understanding what the organization really needed to have in place in order to support realistic growth was one of the most important steps in “turning the corner.”
- Focusing discussions on impact as opposed to costs and efficiencies. This reorientation required a long series of conversations that took place first with a supportive and understanding board, then with the staff. Stakeholders had been accustomed to framing overhead issues as “cost” issues. Johnson purposefully shifted the locus of the discussion to the benefits of increasing the ability of the national office to respond quickly and effectively to regional and local sites. Johnson noted that this factor may have been one of the most important in helping line staff see the value of management capacity in particular.
- Identifying a supportive funder that understood the value of infrastructure investment and was willing to provide LGON with the general operating support it needed to invest in its own infrastructure. “There have been a handful of foundations that provided general operating support…Without it, we’d be in big trouble,” noted Johnson. She said that without this unrestricted money and new development staff who spend a majority of their time looking for unrestricted funds, it likely would not be possible to maintain current levels of overhead.
The Approach and Results
Over the past several years, LGON has made investments in both management capacity and systems. First, LGON invested in its senior team, with non-program staff increasing 150 percent over three years. Second, LGON improved the systems infrastructure to support growth, including developing an intranet for shared calendars, knowledge management, and internal procedure documentation; overhauling software and hardware to reach “state of the art” as opposed to “hand-me-downs from our partners;” and instituting a performance management system that took tracking from a paper-based system with little reporting to an automated system that enabled real-time improvement.
These infrastructure investments have had a positive impact on the organization in several significant ways.
- Organizational focus on impact: As Johnson commented, “Our new systems--along with the right training and emphasis on them--have transformed our culture into one focused on impact. Our outcomes system has staff focused on impact every day because understanding outcomes is central to what we’re doing.”
- Line staff’s ability to refocus on programs: “The system has been a total time saver for the organization…Site staff have a lot more time to spend with kids.”
- Strong central office supports for all sites: “Investments in management capacity and systems at the central office allow sites to focus on day-to-day programs…The central office is now better equipped to provide operational and programmatic supports to sites across the region.”
“We’ve never had such a robust management team as we do now,” Johnson summed up. “[LGON] is a good example of what can and should happen when you pay attention to what’s required in investment. We’re much higher functioning--and our programs are performing better because of these investments.”
Appendix III
Training the Leaders of Tomorrow: Estimating the benefits of technology infrastructure investment
"Our technology investments have had a direct impact on the quality of our programs. Just look at our alumni programs. An essential part of our mission is supporting our alumni in a deep way. Our alumni portal has been vital to connecting our graduates with one another and with us."
The Background
Given the organization’s mission of inspiring and supporting diverse young leaders, it is perhaps not surprising that Training the Leaders of Tomorrow (TLT) repeatedly has called on these young leaders to help improve programs and expand capacity. In its early history, TLT had the help of a group of young leaders in building its technological capacity. In the mid-1990s, these leaders created simple Apple Mac networks in each office that ran basic word processing, spreadsheet, and desktop publishing programs. When the organization received its first AOL account and 2,400 Baud modems, staff members congratulated themselves for adopting technology much earlier than many of its partners and peers in the nonprofit sector who did not even have e-mail accounts.
The Challenges
By the early 2000s, however, it was clear that TLT was no longer a technology leader among its partners and peers. Computers donated to the organization in 1997 were getting ever-slower and crashing regularly. (Out of 66 computers, only 13 were keepers; 29 were obsolete but were still in use nonetheless.) Viruses struck often. The firm that provided accounting software went out of business, so TLT had no access to technical support or upgrades. No one on staff was saving files on network servers or backing up information. Staff had little or no training on how to use basic applications effectively. The website was static and outdated. During a period of rapid growth, TLT fell far behind the technology curve, opening new offices with neither an integrated technology plan nor the capacity to support them.
The Strategy
TLT’s strategy for breaking down (and breaking out of) the vicious cycle centered on making the case for change and ensuring it could be funded.
- Ensuring alignment between executive director and board. TLT’s board has consistently been a strong champion of general operating support and has directly contributed significant amounts of unrestricted funding to support infrastructure development. The support of the board has been crucial in fostering a philosophy that general operating grants are vital and that overhead investment is critical. According to Dickson, “When a big grant didn’t come through, we were thrown into crisis. Our board responded by investing rather than asking for drastic cuts. With our board chair championing the effort, we developed a budget focused on investment in infrastructure, core staff, etc., that would position us for long-term success.”
- Identifying funders willing to support infrastructure investments. TLT has struggled over the years to make sure that it is able to fund its overhead initiatives. They have invested significantly in development staff who can target unrestricted money, and have actively sought pro bono support from major corporations to support their infrastructure development.
The Approach and Results
“We’ve always believed that infrastructure investments--and technology investments in particular--are vital to strong programs,” Dickson explained, “but making the case to funders about the importance of such investments hasn’t been easy, and especially with technology, it’s easy to fall behind quickly.” The organization has therefore remained creative about the ways it funds infrastructure. Specifically, TLT has relied on a mix of strategies over the years to ensure that its technology infrastructure stays effective:
- Pro bono consulting and volunteer advising: TLT would not have been able to overhaul its technology strategy without the support of major pro-bono technology consulting and TLT’s Technology Advisory Board, which it created to help inform its tech strategy.
- Supporting organizational strategy: By integrating technology into the strategic planning process, TLT developed a technology vision that keeps organizational strategy at the forefront of technology planning at all times.
- Developing integrated, customized systems: By integrating all technology systems across the network, TLT has enabled a network that is strong, stable, cost effective, and highly communicative, both with constituents and internal staff.
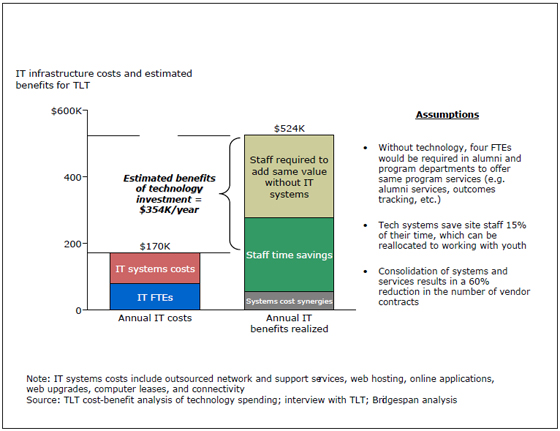
As a result of its best-in-class systems, TLT has been able to quantify the impact of its programs and has been recognized as a national leader in outcomes tracking. Moreover, TLT’s investments in technology tie directly to its programs, particularly in the area of alumni support. Hundreds of TLT alumni around the country are using the system to find leadership opportunities and stay in touch.
Figure A2 summarizes TLT’s cost/benefit analysis of investments in infrastructure.
Figure A2: Cost benefits of TLT’s infrastructure investments
Sources Used for This Article
[1] Appendix I provides Bridgespan’s definition of “overhead.”
[2] Organization names, identifying features, and staff names have been changed.
[3] Most notable among the sources of existing research is the Nonprofit Overhead Cost Project of 2004, which was jointly performed by the Center on Nonprofits and Philanthropy at the Urban Institute and the Center on Philanthropy at Indiana University (www.coststudy.org). In “How Not to Empower the Nonprofit Sector: Under-Resourcing and Misreporting Spending on Organizational Infrastructure,” three of the project’s lead researchers (Kennard Wing, Thomas Pollak, and Patrick Rooney) describe the situation regarding nonprofit overhead as a circle, with four components: pressure to underreport overhead, social norms for acceptable overhead, low funding and spending for overhead, and reduced sector. All of the organizations Bridgespan profiled operate multiple sites and have budgets in the $2 to $10 million range.
[4] The stories of these two organizations are presented in greater detail in Appendices 2 and 3.
[5] Mark A. Hager, Thomas Pollak, and Patrick H. Rooney, “What We Know About Overhead Costs in the Nonprofit Sector,” Nonprofit Overhead Cost Project of the Center on Nonprofits and Philanthropy at the Urban Institute and the Center on Philanthropy at Indiana University, 2004.
[6] The nonprofit referenced here is “Organization 3” in our study. It is an $8 million youth-service organization. The quote highlights how claims made by some nonprofits (e.g., “100% of your contribution goes to charity”) can be made credibly when overhead costs are covered in other ways. That is, it is possible to tell the story of low overhead to a group of donors (e.g., individuals) to the extent that overhead costs: are covered by another pool of unrestricted funds, are donated (e.g., by board members), or are spread across or shifted to different legal entities.
[7] Bridgespan definition of overhead, included in Appendix I, includes marketing and communications expenses as well as research and development expenses. Only one case study participant, Organization 2, had R&D expenses.
[8] Compustat; Standard & Poor’s Global Industry Classification Standard Structure.
[9] “BBB Wise Giving Alliance Donor Expectations Survey,” Princeton Research Associates, 2001.
[10] Finance director of a $10 million youth-services organization (Organization 2).
[11] CFO, Organization 3.
[12] Finance director, Organization 2.
[13] Holly Hall, Harvy Lipman, and Martha Voelz, “Charities Zero-Sum Filing Game,” Chronicle of Philanthropy, May 18, 2000.
[14] Ibid.
[15] Kennard Wing and Mark Hager, "Who Feels Pressure to Contain Overhead Costs?," Center on Nonprofits and Philanthropy at the Urban Institute, 2004.
[16] Clara Miller, “The Looking Glass World of Nonprofit Money,” Nonprofit Quarterly, 2005.
[17] White House Office of Management and Budget, Circular A-122 (Revised).
[18] Case study interviews.
[19] Individual and organization name changed, as well as some identifying features of the organization.
[20] Organization and staff names have been changed.


